
COVID-19 news
State Data Overview |
|
|
Vaccination rates by State
|
|
|
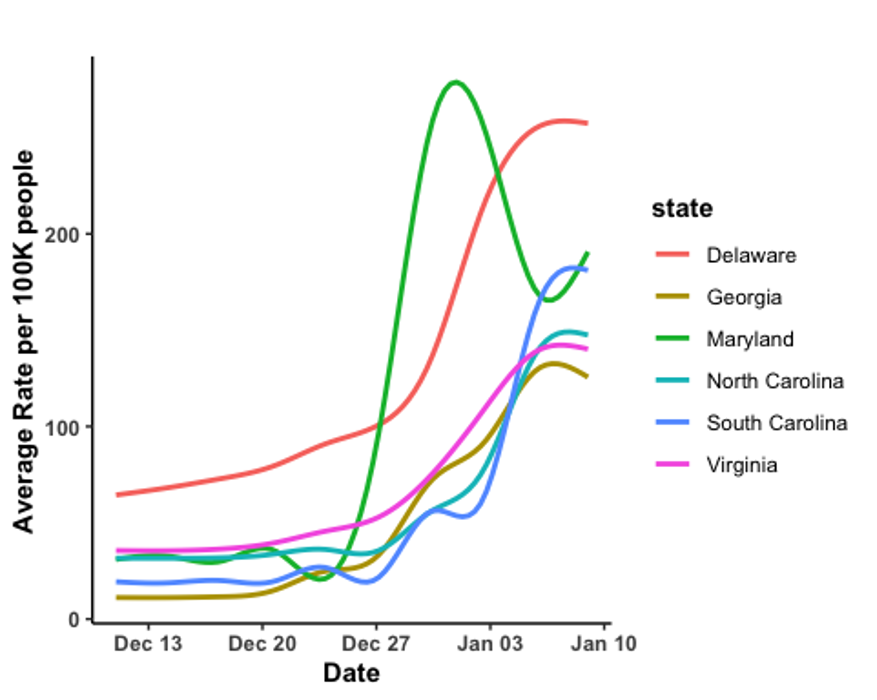
COVID-19 rates per 100K people by state |
|
 |
|
|
|
|
State Snapshots |
|
Delaware
|
|
|
Vaccination rates by county
COVID-19 rates per 100K people by county |
|
 |
|
|
|
|
Maryland
|
|
|
Vaccination rates by county |
|
COVID-19 rates per 100K people by county |
|
 |
|
|
|
|
Virginia |
|
|
|
|
Vaccination rates by county
COVID-19 rates per 100K people by county |
|
 |
|
|
|
|
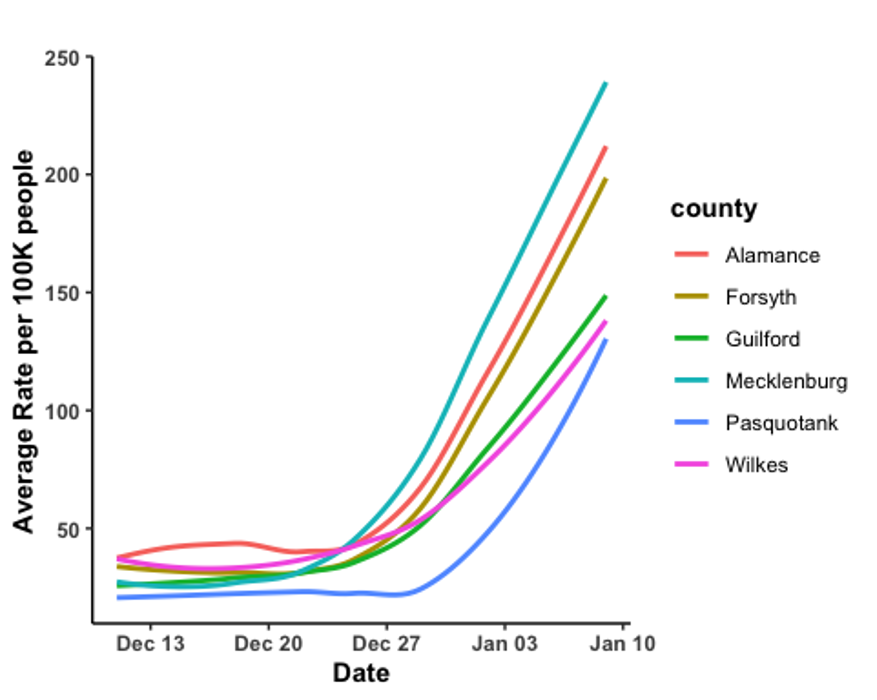
North Carolina
Vaccination rates by county
COVID-19 rates per 100K people by county |
|
 |
|
|
|
|
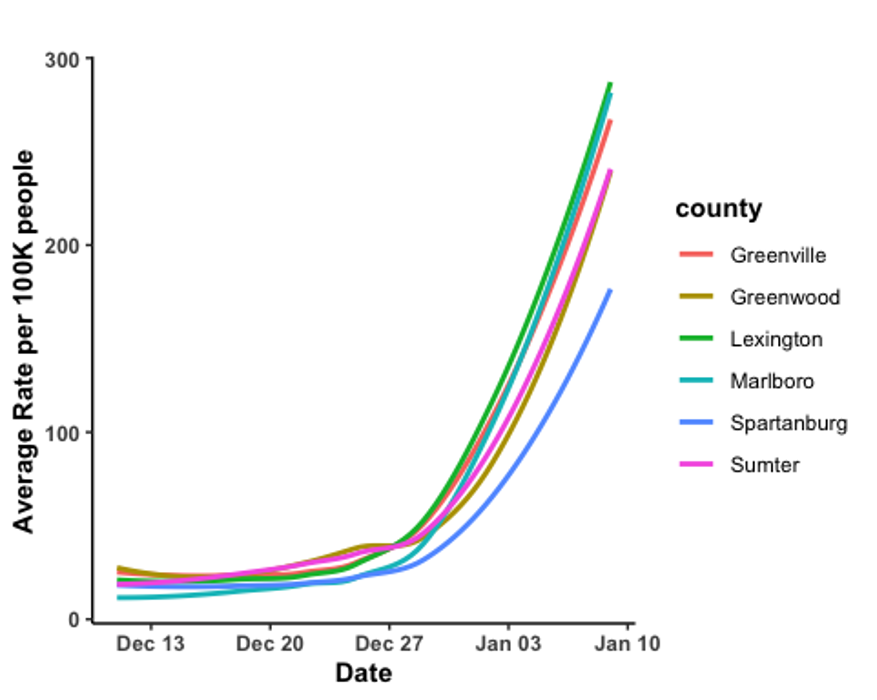
South Carolina |
|
|
|
|
Vaccination rates by county
COVID-19 rates per 100K people by county |
|
 |
|
|
|
|
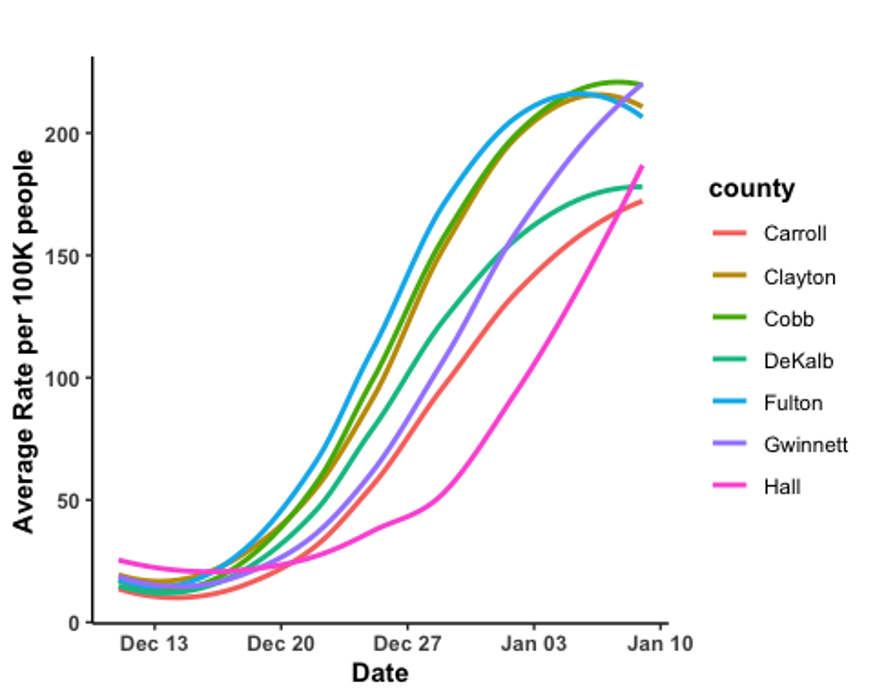
Georgia |
|
|
|
|
Vaccination rates by county
COVID-19 rates per 100K people by county |
|
 |
|